This is my first post on request. Thanks Ashish! As a follow-up to the Estimation Post, i am going to write about a great top down technique to estimate project SIZE called function point analysis. Before we get to the "How" lets know the "Why(s)"
WHY
- Standard benchmark technique across organizations throughout the world - If 2 organization perform an estimate for the same piece of work, their function point counts should be exactly same in a perfect world.
- Technology Independent - Keeps the Technology out of the exercise. Once the size is estimated, different technology effort estimates can be derived using productivity.
- Can be used to monitor scope creep by doing FPA at each phase of project.
- Does not require you to know all the details of the work you are estimating - The goal is to know what you need for the FPA count and that is ILF, EIF, EI , EO, EQ. So long as you can count these, you're good to go. Will talk more about it later.
- Very good for estimating systems with UI interfaces and data storage.
- Take an organization's Actual Results into account to arrive at the effort - Since FPA is a size estimation technique, the Effort estimates are arrived at using a simplistic formula. Effort = # of Function Point / Productivity. Productivity is calculated by looking at the organization's record of executing projects in similar domain (Technology and Business). For example, a company ABC created an application called charlize :) and in the estimation phase estimated it to be 100 Function Points. They delivered the project by consuming an effort of 2000 person hours (overrun, communication, delays everything included) . Then, whenever they do a project similar to charlize (in domain and technology) the productivity they can use is 100/2000= .05 FP/Hr . As the company does more and more projects, the productivity figures become more mature and the organization takes an average figure into account.
Word of Caution
- First Timers -For people or companies using FPA the first time, it is good to do small sample projects and arrive at some baseline productivity figures. Alternatively, there are published figures on the Internet for productivity - Those can give you an indicative guidance. I prefer the former.
- NOT for for creative and non-GUI projects.
- NOT for high complexity logical programming - If you want to design, code a cubing and stacking algorithm for a transport company. FPA might not be the best thing to do.
- NOT For Maintenance projects
Function Points EXPLODED!
STEP 1 - Defining the Application BoundaryThe first activity in FPA is defining the Application boundary. This boundary must be drawn according to the user’s point of view. The boundary indicates the border between the project or application being measured and the external applications or user domain. Once the border has been established, components can be classified, ranked and tallied
STEP 2- Finding all 5 Major Components
FPA addresses 2 fundamental types of data in a system.Data at motion - Data entering or leaving the application boundary. These can be External Inputs, External Queries or External Outputs.
Data at rest - Data maintained by the application. These are the internal logical files in an application. Also, internal logical files maintained by "other" applications outside the application boundary are counted as External Interface Files.
*For examples of each type of component, Click Here.
- Component 1 - External Inputs (EI) - is an elementary process in which data crosses the boundary from outside to inside. This data may come from a data input screen or another application. The data may be used to maintain one or more internal logical files. The data can be either control information or business information. If the data is control information it does not have to update an internal logical file. The graphic represents a simple EI that updates 2 ILF's (FTR's).
- Component 2 -External Outputs (EO) - an elementary process in which derived data passes across the boundary from inside to outside. Additionally, an EO may update an ILF. The data creates reports or output files sent to other applications. These reports and files are created from one or more internal logical files and external interface file. The following graphic represents on EO with 2 FTR's there is derived information (green) that has been derived from the ILF's
- Component 3 - External Inquiry (EQ) - an elementary process with both input and output components that result in data retrieval from one or more internal logical files and external interface files. The input process does not update any Internal Logical Files, and the output side does not contain derived data. The graphic below represents an EQ with two ILF's and no derived data.
- Component 4 - Internal Logical Files (ILF’s) - a user identifiable group of logically related data that resides entirely within the applications boundary and is maintained through external inputs.
- Component 5 - External Interface Files (EIF’s) - a user identifiable group of logically related data that is used for reference purposes only. The data resides entirely outside the application and is maintained by another application. The external interface file is an internal logical file for another application.
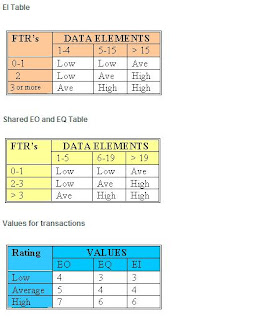
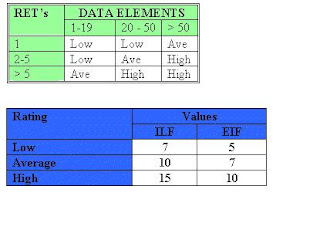
After the components have been classified as one of the five major components (EI’s, EO’s, EQ’s, ILF’s or EIF’s), a ranking of low, average or high is assigned. The classification of the components is purely based on How many DETs and RETs/FTRs you count for each component.
For transactions (EI’s, EO’s, EQ’s) the ranking is based upon the number of files updated or referenced (FTR’s) and the number of data element types (DET’s).
For both ILF’s and EIF’s files the ranking is based upon record element types (RET’s) and data element types (DET’s). A record element type is a user recognizable subgroup of data elements within an ILF or EIF. A data element type is a unique user recognizable, non recursive, field.
Based on the counts, a complexity and therefor a number is associated with each component. Have a look at the attached tables


I KNOW THIS IS CRYPTIC - JUST DIGEST THIS AND IN MY NEXT POST, I WILL HOST A REAL LIFE EXAMPLE WITH ALL THESE FIGURES EXPLAINED.
Step 4 - Computing the Counts (Unadjusted)
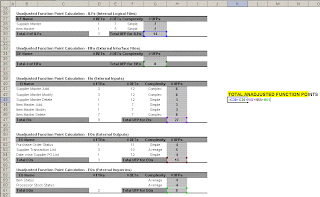
The counts for each level of complexity for each type of component can be entered into a table such as the following one. Each count is multiplied by the numerical rating shown to determine the rated value. The rated values on each row are summed across the table, giving a total value for each type of component. These totals are then summed across the table, giving a total value for each type of component. These totals are then summed up to arrive at the Total Number of Unadjusted Function Points.
In this case the TOTAL is 62 (Click on Image for full view of table)
Step 5- Calculate the Value adjustment Factor (VAF) and Adjusted Function Points
To arrive at Adjusted function points, the VAF is derived so that you can apply the following formula
Adjusted Function Points = Undjusted Function Points* VAF
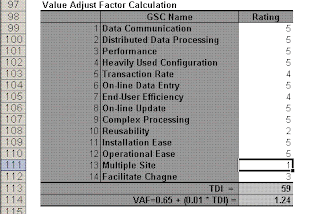
The value adjustment factor (VAF) is based on 14 general system characteristics (GSC's) that rate the general functionality of the application being counted. Each characteristic has associated descriptions that help determine the degrees of influence of the characteristics. The degrees of influence range on a scale of zero to five, from no influence to strong influence. This is where your experience comes into play and you can impact your function point count based on your understanding of the application and it's general characteristics.
In this case the VSF comes to be 1.24
Therefore our Adjusted Function Points = 1.24*62 = 76.88!!!!
Step 6 - Calculate the Effort
Lets assume that the productivity is .125 function points/Hr
Therefore, Actual Effort = 76.88/.125 = 615 Hours
Promise - NEXT POST WILL BE AN ACTUAL CASE STUDY SAMPLE!


No comments:
Post a Comment